Targeting and traffic measurement
The publishers do their best to make more and more people click on their links and perform the required actions on the advertiser’s website as the more people perform it, the higher reward the publisher will get. The users who perform actions are so-called traffic which publishers attract/drive to their ad space or directly to the advertiser’s website.
Despite the fact that traffic is initially appeared to be an impersonal flow which can be described by a set of mutual characteristics (gender, age, location, search queries, interests and so on), it is essential to remember that traffic is people who are alive and have some certain purposes, interests, and motives for making decisions (including purchase). Thus each advertisement you create should be attractive, interesting and motivating to buy, not to close the website.
Here are some logical assumptions:
 The more people see my ads, the more clicks on my link I will get.
The more people click on my link, the more will perform the required action so I will get a higher reward.
Therefore, the more people see my ads, the more will perform the required action.
In general, everything looks pretty logical… But it won’t work because of one fact: if it is not a targeted audience, users won’t click on the links nor perform the required action no matter how creative your ads are. This will lead to losses: the least what can happen is that the audience will lose the interest and you will lose time on starting the promotion campaign, the worse result that can happen is that you will waste the budget on advertising and it won’t worth it. Here we come to the conclusion that not only quantity but also quality matters.
In this article we will review how to make the traffic targeted, why traffic can be of poor quality and how to evaluate the quality of an advertising campaign. And we examine an example of how you can calculate traffic and make conclusions upon the results.
Quality: describing the audience profile
Good traffic should be targeted. What does it mean? It means that the offer should be at least interesting for the audience, and it will be best if the users will definitely want it. Let’s take a look at the example.
Providing that you have decided to promote the offer in the category “Beauty & Health” and you want to make money on cosmetics. First of all, we need to understand who will be interested in this offer.
Sometimes advertisers provide all demographic information such as average age, gender, activity on the internet, average revenue, location, in other cases, publishers need to identify the target audience by themselves. Alright, let’s imagine that the target audience of an offer with cosmetics is approximately the following:
Age:
20-25 — 29%
26-35 — 41%
Region (GEO):
New York — 59,3%
Los Angeles — 16,3%
Cities with the population over 1 million people. — 9,8%
Others — 14,6%.
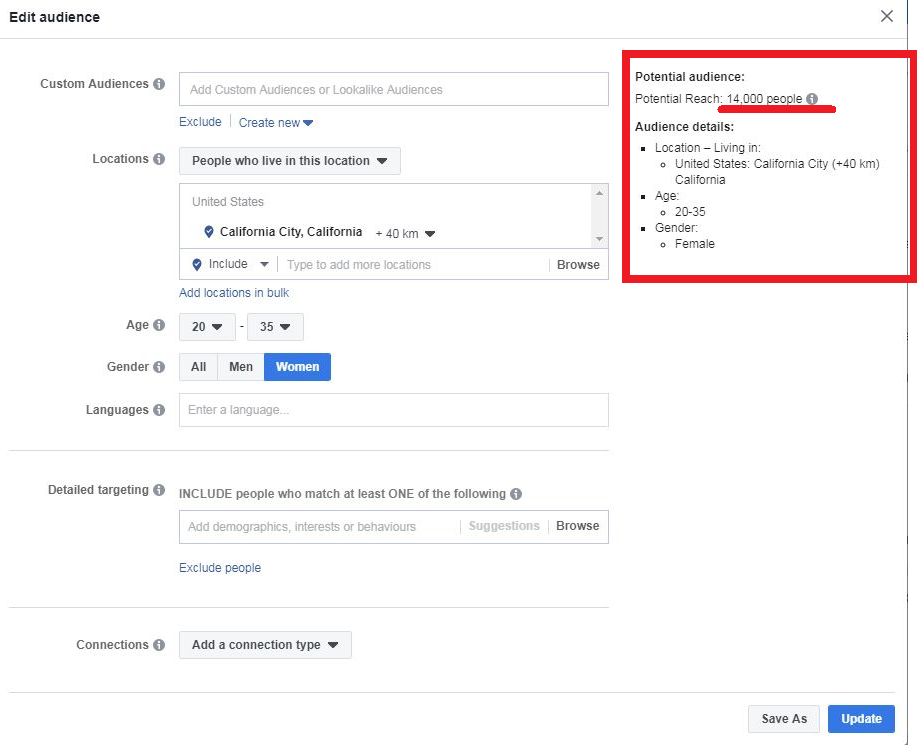
We can assume that a woman of 20-35-year-old who lives in New York can use a selling product (providing the fact that women of this age use cosmetics), moreover she can think “I want it!” as soon as she sees it (it means that she will start feeling the desire to purchase the product).
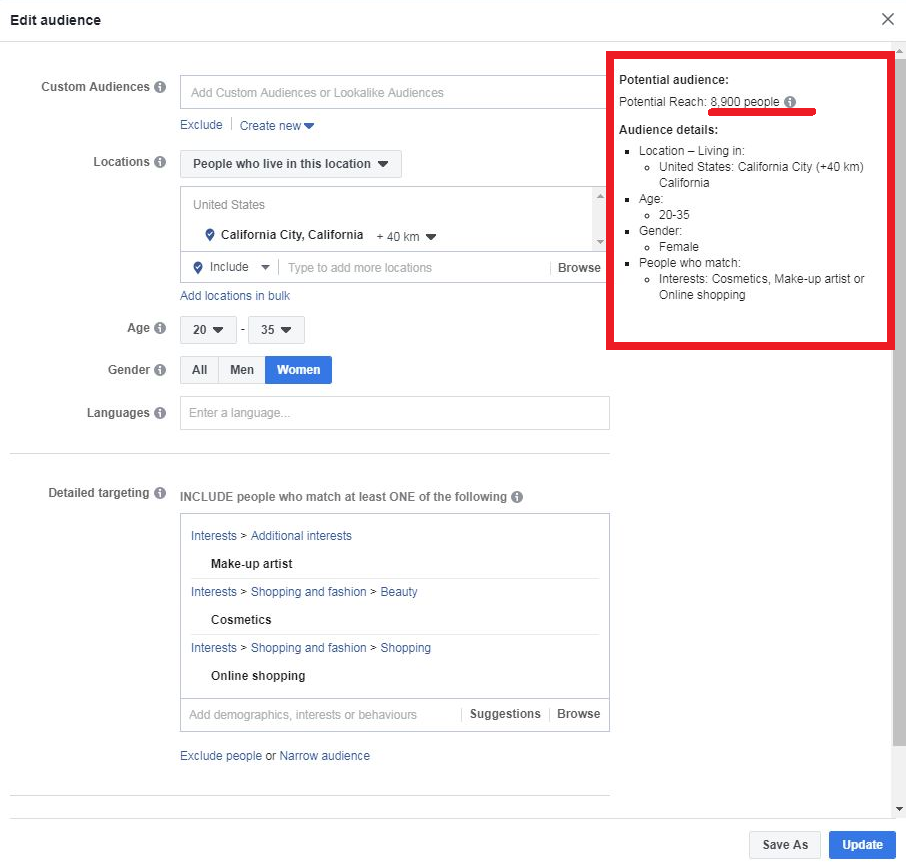
There are many women of 20-35-year-old in New York so the audience is very wide what seems to be good but to reach this audience it would cost millions of USD. Therefore, the audience should be more specified by the detailed description. To promote this offer we need the following women of this age: who use the internet for shopping; who like make-up and cosmetics. The features of targeting will change depending on which platform you choose for promotion.
If you think that by adding interests we cut the audience but we need to reach as many people as possible, you are wrong. The main aim is to show the advertisement to the most targeted audience so that the majority of them will click on links and make purchases. The better the audience is described, the more effective the promotional campaign will be.
Why is the audience description useful?
Each group with similar interests have some specific terminology. For example, such words as “look” “beauty blender” won’t look weird for those who like cosmetics, but gamers or scientists may not understand them at all. Thus if you understand the “language” of your audience well, you’ll use the proper words and the audience will notice your advertisement.
We will understand their key issues, interests, and wishes. The interests of the people of 20-year-old and 30-year-old differ significantly, plus we should take into account gender, place of living, marital status, income and thus we will get several target audiences.
We can track the way from when a user understood that some product is needed up to the moment of making the decision to purchase. Some people tend to analyze and compare several options while others make spontaneous decisions, so for the first category you need a detailed description of the products, several reviews, and comments, but for the second one a bright image, provocative headlines will be more appropriate.
We can determine their motives — why they make a particular choice. One will spend hours on searching for the best price, other will look for express delivery, somebody else will search for gift packaging option. Somebody knows in advance what and when to buy (for example, snow tires), others will make an impulse purchase right after seeing some product for the first time (cosmetics, t-shirts). Sometimes just a simple thing can be the reason for the purchase, your task is to determine this thing and emphasize it so that the product will be bought.
It is important to understand not only who our audience is, but also what they want — a woman of 50-year-old or older doesn’t look for a cream for “old skin”, but “anti-age”. Or some users who have average income want to buy brand products to feel like they belong to the upper class. Be wiser and offer the users a solution to all their problems before they realize that they need this solution.
There are several marketing methods of understanding how the target audience make decisions — expert opinion (you can ask several people who know the product category very well), survey (the more answers you get, the better, but make sure that the audience is relevant) and trial method (you launch campaigns and test them, then upon the results you develop the best one). Likewise, don’t ignore the research results and other data which are in the public domain. The right query in the search can help you understand what’s your target audience look like and what they want.
Not only untargeted audience is inappropriate. An advertiser can disconnect publishers because of many reasons: if they use sites which brand doesn’t want to be associated with (for example, Adult websites for promoting goods for children), if publishers use brand bidding (this traffic type is described in details in the article «What types of traffic are there in Admitad?»), if the publishers send the offers to the followers of advertiser’s community on social networks (the advertiser has already spent money on attracting people to the community and he is already using these contacts), if they send emails to subscribers like 10 times per day and the mailouts look like spam (subscribers associate brand with spam and get annoyed). One traffic source can be very effective for some brand, but completely ineffective for another one. Before starting any promotional campaign check the rules of the offer so that you don’t waste your time and money. Check out our article “Come to the light side, we have cookies: shadow traffic in affiliate networks” to find out more about forbidden traffic.
The advertisers expect you to attract new traffic to their offers, not to steal their traffic and pretend that it is yours.
Quantity: calculation of target indicators
Alright, having realized how you can describe the audience and understand its worries, it is time to talk about quantity. Now we are going to look through the following points: how to calculate traffic, how to evaluate it and why you need it.
First of all, you should understand the purpose. A clear purpose can help to manage the ad spaces and increase the earnings. Which features should an accurate purpose have?
Measurable. You should understand how much money you want to earn. “Much” isn’t a purpose. 1000 USD — that’s much better.
Time-limited. Set the time limit when you want to achieve your goal. “I want much money asap» is hardly achievable, but “I should reach a profit of 1000 USD per month within a half-year” — sounds much better.
Realistic. Fairly evaluate your skills and opportunities. Having set a higher goal, you motivate yourself to achieve better results. But if you overestimate yourself, you can end up with nothing.
It is hard to predict potential profit in the beginning, but having worked for a while, you will be able to anticipate how much approximately you can earn on some particular campaign. Moreover, the more you test the ad spaces and business models, the more results you will get what will assist you in forecasting of future profit.
Let’s look through a purchase funnel and try to forecast the approximate earnings. You’ve set a purpose to earn 1000 USD per month from your promotional campaign. Let’s pretend that you have selected an offer which reward is 10 USD per paid offer, and according to the statistics around 55% of orders are confirmed. To earn the sum you want, you need an advertiser to approve at least 100 paid orders made through your link, and for that, you need to attract 180 users who will make an order on the advertiser’s website. Now you should check the offer description for the following characteristics: the average ratio of the number of purchases to the number of clicks on the link (CR — conversion rate) is 4,11% — this is the proportion of users who proceeded through the link and made the purchase. Having conducted simple calculations we can see that to achieve our goal of 180 paid orders at least 4380 people have to proceed through our link. Then it’s CTR (click through rate) that shows how many people clicked on the link after seeing the ad. It is pretty hard to forecast which CTR your ad will have as it depends on the ad type you use (banners, teasers, video, text, contextual etc.), on competition within the segment, the quality, and creativity of an ad. Let’s imagine that you have decided to use a banner for your promotional campaign, the CTR is 2% what is good taking into account the banner blindness. It means that 4380 clicks account for only 2% of the number of people who saw the ad. Thus we can conclude that you need to get at least 219 000 views. In order to optimize the whole process, you need to increase CTR and CR what requires testing different ads, advertising spaces, and targeting.
Conclusion: if you want to attract 100 users who will pay for orders which will be approved by the advertiser and so you’ll get the reward, at least 219 000 users should see your advertisement. But one thing that should be revealed is that we are talking about average indicators and some publishers have higher results while the others have lower even if they are working with the same offer and have similar ad spaces. Moreover, you shouldn’t think that all numbers which are written in the offer description apply to every case at 100%. In real life, you should test several campaigns through different traffic channels, and having tested for a month, evaluate the results and keep promoting based on which campaigns work the best.
One more metric which is used to measure the advertising effectiveness — RO(M)I ( Return on (Marketing) Investments). It shows if you have spent your marketing budget effectively. In our case, the ROMI can be measured like = ((Income from approved orders – expenses on driving traffic)/expenses on driving traffic)*100. If this value is more than zero, we can assume that expenses on advertising are reasonable, if it isn’t — it is better to think of adjusting the promotional campaign and to check if the offer is relevant to your ad space or audience. This measurement won’t work for each channel, it’s better not to use it for sophisticated campaigns, but for some specific deals (like an email with an exact offer or review of one product) it will be relevant.
Now let’s check how to calculate and interpret the advertising indicators and how they help to compare the traffic channels.
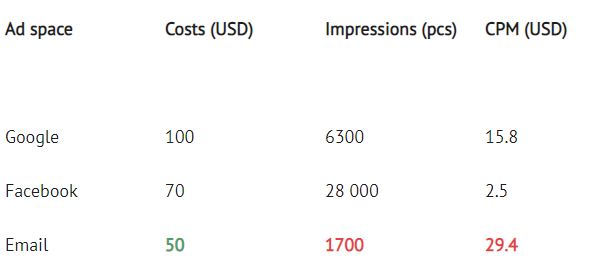
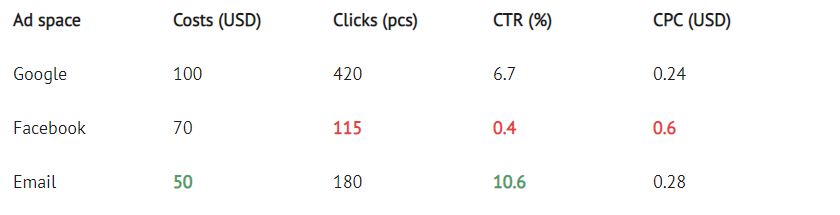
Providing that we decided to use for promotion Google Adwords, Facebook ads, email marketing and allocated different budgets for each channel. The most expensive was Google and the email marketing turned out to be the least expensive. The first result which we have is how many times our ad is shown on each channel. Facebook has the highest number of impressions when email marketing has the lowest.
Now let’s calculate CPM (Cost per Mille, the cost of showing an ad to 1000 people) using the equation (Expenses/Impressions)*1000 and we get that the most profitable “impression” for us is on Facebook and the most expensive is via email. Do these figures show us the proper answer on which channel is the most effective? — No, they don’t as the impression is only the primary indicator which shows the audience reach but not the reaction to the ad.
Then we need to check the number of clicks per one ad: the highest number goes to Google while Facebook has the lowest.
We can evaluate the clicks upon two following metrics: CTR — the indicator of clickability (Click through Rate) and CPC ( Cost per Click). In the first case, CTR = (Clicks/Impressions)*100% we evaluate which % of people clicked after seeing the ad, in the second case you can evaluate how much each click costs CPC = (Costs/Clicks). Here the situation changes: the highest cost of a click on Facebook makes this channel the least profitable. Facebook also doesn’t show good clickability (only 0.4% of users who saw the ad clicked on it), and email marketing shows the best results — 10.6% of audience clicked on the link to find out more about the deal.
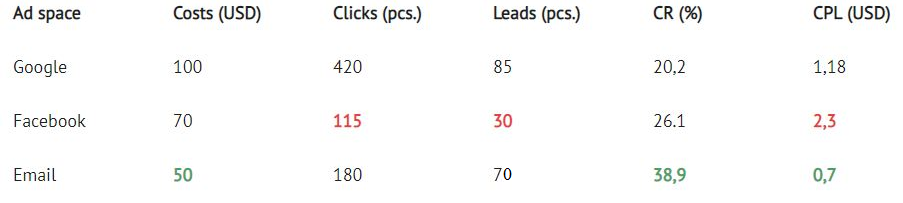
Alright, now we want to know if our channels were effective in attracting orders. The majority of orders came through Google, the least number — through Facebook.
It still doesn’t mean that Facebook is the least effective and Google is the most: the next thing which you should look at is the conversion (CR) to orders, and here we see that Facebook shows higher results than Google, but Email provides the best result of 38,9%. Thus the cost of an order for a publisher was the maximum 2,3 USD on Facebook and the minimum 0,7 USD through email. That is what we can see from CPL metric ( Cost per Lead). By “lead” we mean a person who registered in the service or even ordered something but didn’t pay yet.
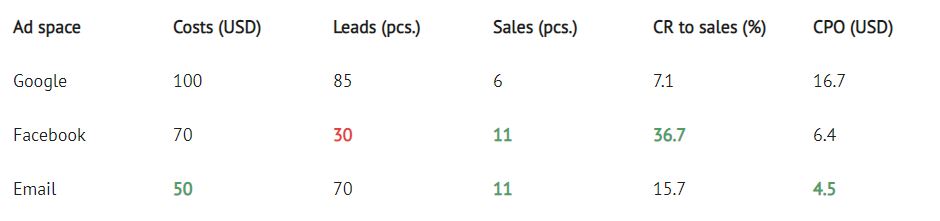
We are mostly interested in sales because we will receive the reward for them. According to our results, Facebook and email are leaders but it is still too early to make the final conclusion.
Now let’s look at the conversion to sales, in other words, which % of those who made orders actually paid them. As we can see, Facebook has the highest rate (36,7%). Consequently, we can calculate the cost of attracting one real customer through each channel. To calculate the cost of each sale we need to divide our costs by the number of orders and by this we get CPO (Cost per Order), Google has the worst result (16.7 USD per person), and email marketing cost the least — only 4.5 USD per customer.
In this example, we assume that 100% of sales have been approved. But it is necessary to keep in mind that some orders may be not approved after the reconciliation. And in this case, it is better to include the approval rate.
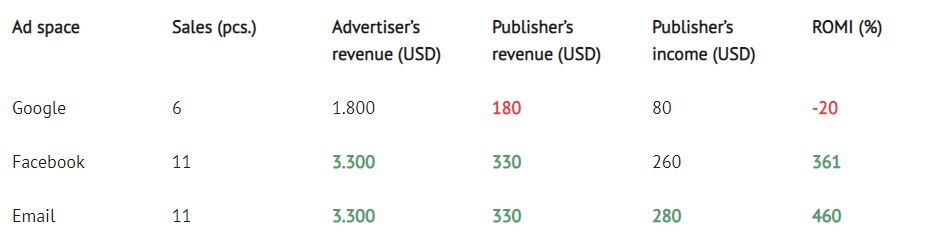
Supposing that a customer pays 300 USD per order and advertiser gives 10% of this sum to a publisher as a reward. Consequently, the maximum revenue the advertiser and the publisher will get through Facebook and email marketing.
For the final evaluation we need to calculate ROMI. With the smallest investments email marketing showed the best results. Google showed the worst results but it wasn’t that bad as we didn’t invest more money than we earned, so it is still a good result.
So which results have we received?
 We spent like 45% of our budget on Google and received like 23% of all orders what is not much. This channel hasn’t shown the best results as the ROMI is negative, but if you create something more interesting and increase the budget, you have a chance to improve the results.
We’ve spent like 33% of our budget on Facebook and got around 39% of orders through it. Facebook shows pretty good results but you can still develop the quality of content and advertisements in order to increase the number of clicks and orders. Based on the information on how the orders are converted to sales, we can say that targeting works pretty well.
And the leader of the whole campaign is email marketing: we allocated around 22% of our budget, it brought us 39% of orders. Although the reach wasn’t that wide, the audience was the most targeted and the offer was relevant to them. Thus we can conclude that it is necessary to increase the number of contacts in the email list (but of course, legally) and continue promoting through this channel. But keep in mind that you still have to perform rational promotion, not racing for money by sending tens of emails every day.
If you see in your statistics that one channel is more effective than others, it is still not a sufficient reason to neglect all other channels, but it is like a hint to pay attention to the most ineffective indicators (CPM, CTR, CPC, CPL, ROI, conversions), at which moment the problems occur and why.
Tips on analyzing the traffic source
Check the ad indicators as often as possible (at least once per day). It’s better to collect data during the month and only on the closed orders (approved or declined). It is better not to take into account the orders with the “on hold” status as they will artificially inflate the indicators.
Structure the information — use tables which will help you visualize the data and compare figures.
Use Admitad tools (Deeplink and SubID) which will be useful for distinguishing the campaigns and lead users to certain products.
In order to create a relatively accurate forecast for the future campaigns, carry out different tests and rely on the obtained results instead of the average indicators which are specified in the affiliate program in the catalog of offers. The information indicated in the program is average and it includes the results of both professional publishers and newbies.
Check regularly the offers which you’ve joined: in case if an advertiser changes the terms, your calculations with out-of-date information won’t be correct. Of course, advertisers and the affiliate network informa all publishers about the changes in advance, but if it was you who missed the notification, it will be hard to prove the earnings.